

Before I focus on this week’s stock, I want to answer a smart question from a dear reader:
“Thanks for this analysis. It is very helpful, but can you help explain why some stocks rise and fall according to valuation metrics like these while other stocks seem to play by different rules? So many stocks trade at nosebleed valuations and rise and fall strictly on momentum.”
That is a fair question.
The market does not run on one force. Stock prices move for many reasons. Earnings matter. Cash flow matters. Interest rates matter. The story investors tell themselves matters too.
The Value Meter is built to judge two things that often get pushed aside when the market gets excited: value and quality.
We look at enterprise value, free cash flow, and net asset value. Enterprise value is a fuller way to size up what investors are paying for a business. Free cash flow is the cash a company has left after paying the necessary expenses to keep the business running. Net asset value is the value of a company’s assets after subtracting its liabilities.
Those numbers help us ask a simple question: What are investors paying for the business, and how much real cash is that business producing from what it owns?
That is why we use EV/NAV and FCF/NAV. EV/NAV tells us what investors are paying compared with the company’s net assets. FCF/NAV tells us how much free cash flow the company produces from those net assets. Together, they give us a cleaner view than many standard value measures can by themselves.
We also look at how often free cash flow has grown from one quarter to the next. A company with strong cash flow is good. A company with strong and steady cash flow is better.
But the reader’s point still stands.
Some stocks rise because the numbers already support them. Others rise because investors are excited about what may happen later. Those stocks can keep climbing. Momentum is real… but it is not the same thing as value.
The Value Meter is not built to chase market euphoria. It is built to ask whether the current price has enough support from the company’s actual financial strength.
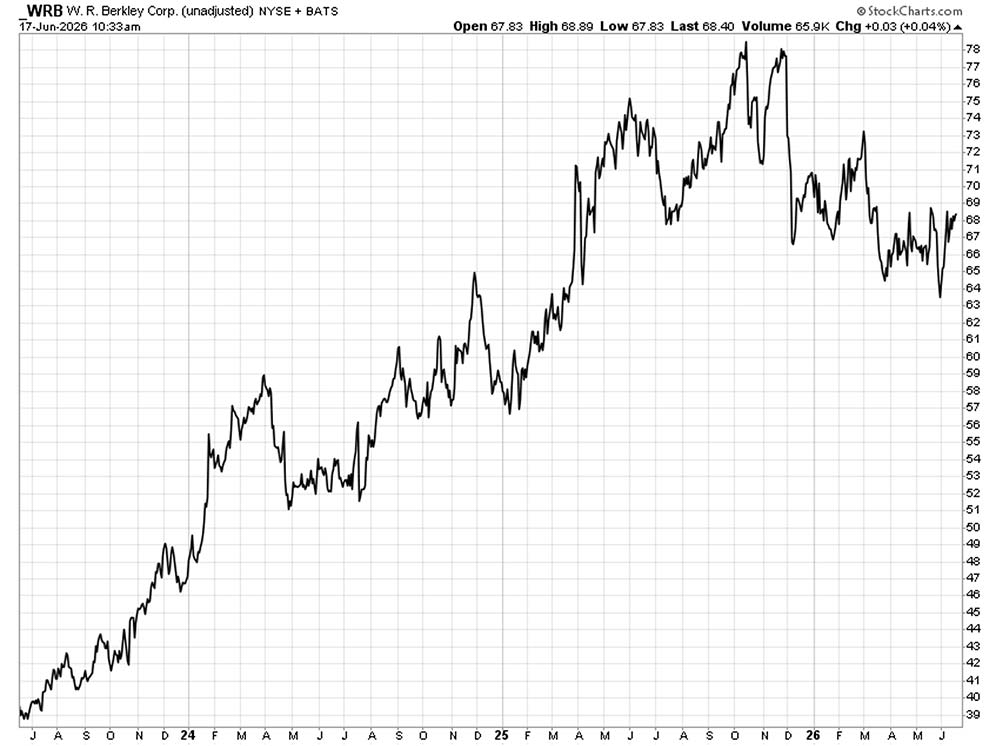
That brings us to W.R. Berkley (NYSE: WRB).
Berkley writes insurance and reinsurance. It gets paid to price risk. It collects premiums, invests that money, and pays claims when losses come due.
That is not a glamorous business. But when it’s done well, it can be a very good one.
In the first quarter of 2026, Berkley’s revenue rose 5% from $3.5 billion a year earlier to $3.7 billion. Net income climbed 23% from $417.6 million to $515.2 million.
The company also produced $667.9 million in operating cash flow. That was down 10% from $743.8 million a year ago.
So the setup is not perfect. Profit rose, yet cash flow dipped. The cash trend was not as clean as the earnings growth.
That matters because insurance can look simple from the outside. Premiums come in. Claims go out. The company invests the difference. The hard part is doing that without underpricing risk or letting claims eat the business alive.
Berkley’s latest results suggest it is still doing that job well.
The stock has also been treated well by investors over the past few years. More recently, though, the mood has looked less aggressive. The shares have not acted like a market darling racing ahead on fresh hype.
That fits the evidence.
Berkley is a strong business, but it is not a dream stock. Investors appear to be respecting it while still asking for more proof before paying much more.
That is where the value question gets interesting.
A good company is not always a good value. The stock still has to earn its price.
The first thing The Value Meter checks is what investors are paying compared with what the company owns.
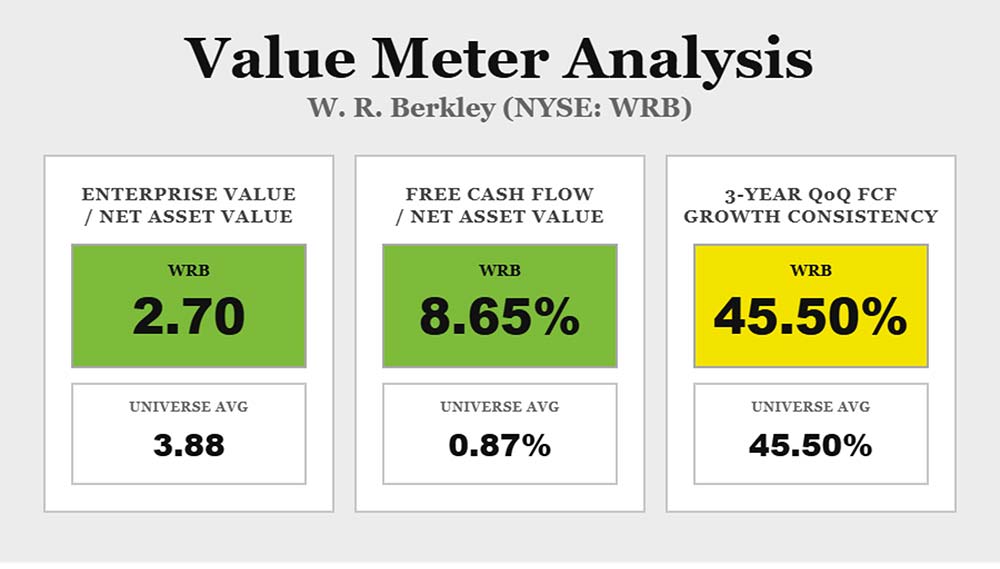
Berkley’s EV/NAV is 2.70. The broad market average is 3.88, so the company’s EV/NAV is about 30% lower than average.
That means investors are paying less for Berkley relative to its net asset value than they are for the average stock in the market.
The cash flow picture is even stronger.
Berkley’s trailing 12-month FCF/NAV is 8.65%, while the broad market average is 0.87%. In other words, the company’s FCF/NAV is about 897% higher than average.
That is the best part of this setup. Berkley is producing far more free cash flow relative to its net asset value than the average company.
Cash is not a theory. It gives a company options. It can support the balance sheet, fund growth, enable stock buybacks, or be returned to shareholders.
But strong cash flow is not the same as steady cash flow.
Over the past three years, Berkley’s quarterly free cash flow has grown from the prior quarter 45.5% of the time. The broad market average is also 45.5%.
That’s why the stock is not a screaming bargain. The company has a compelling value case, but not a flawless one.
Berkley earns a positive value call because the price is reasonable and the cash output is impressive. It falls short of a stronger call because that cash flow has not grown at a steady rhythm.
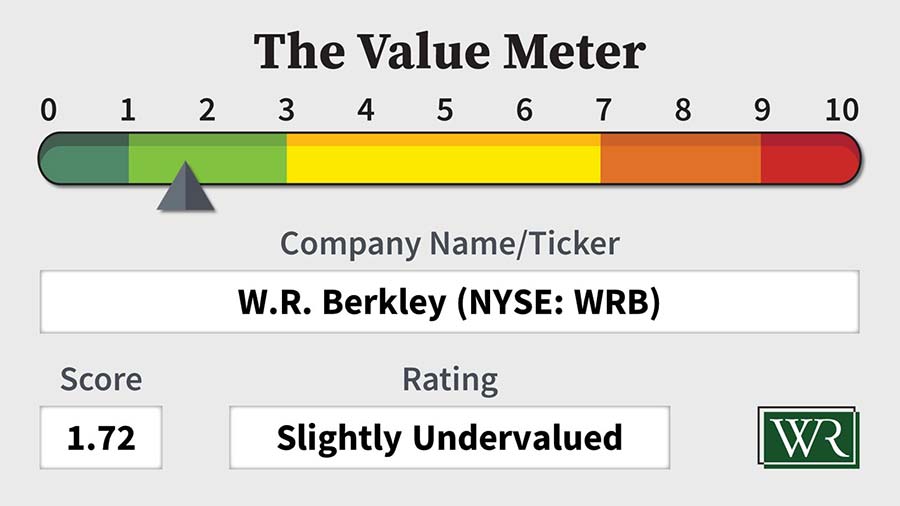
The Value Meter rates W.R. Berkley as “Slightly Undervalued.”
What stock would you like me to run through The Value Meter next? Post the ticker symbol(s) in the comments section below.


