

People hate when I show them this chart.
Most investors are perpetually Pollyanna-ish. If the market’s up, all is well.
Not me.
I deal in facts, figures, and plain truths – whether they make me comfortable or not.
That’s not cynicism. It’s realism. And realism pays.
So when I say people hate this chart, it’s because there’s nothing comfortable about it.
The cyclically adjusted price-to-earnings (CAPE) ratio – also called P/E 10 – uses inflation-adjusted earnings averaged over the past decade. It smooths the cycle and gives a clearer long-term view of price versus earnings.
The chart below plots the CAPE of the S&P 500 in standard deviations from its long-term mean. In simple terms, it shows how far today’s valuation sits from “normal.”
Right now the reading is near three standard deviations above average.
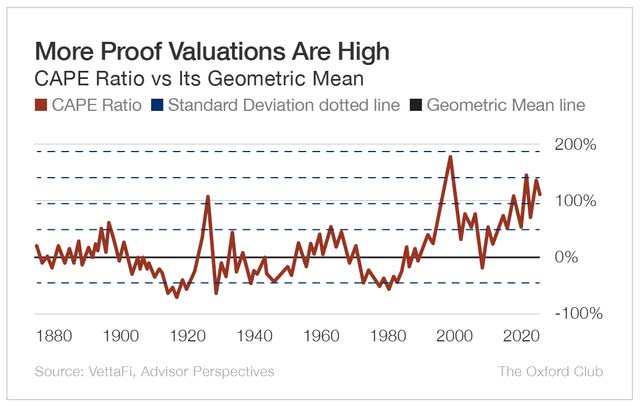
That is an extreme level by any historical yardstick. Readings that high show up only a tiny fraction of the time – roughly a few tenths of one percent.
For years, I’ve tried to alert investors to the market’s rich valuation. But we live in a value-blind regime. Most folks only care about rising prices and earnings growth.
Those matter. But they’re not everything.
When you focus on the right things – not just surface-level hype – you become a more principled, disciplined investor.
It doesn’t mean you stop investing. It means you raise your standards.
A market drenched in rich valuations isn’t one to avoid. It’s one that demands scrutiny and wisdom – the kind value investors have practiced for decades.
You weigh price against quality. You insist on a margin of safety. You accept that the crowd can be wrong for a long time.
Frankly, I like when most people ignore this. It gives me an edge. I look where others won’t because they’re busy chasing buzz. (My August 15 Value Meter column is a perfect example.)
Right now, the best values I see are in small caps. They trade at a clear discount to large caps.
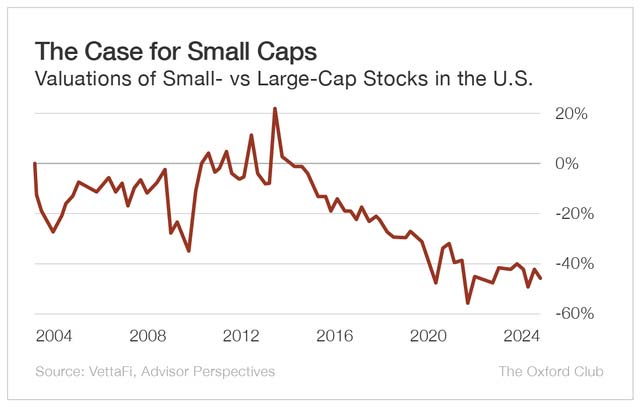
Over full market cycles, that’s often where leadership flips and excess returns emerge. So long-term investors should be ecstatic about this.
History favors small caps on a global scale, which makes today a real opportunity.
But don’t look only at the U.S.
Over the past 20 years, U.S. small caps have lagged large caps. But abroad, the story flips. In developed international markets – and in emerging markets – small caps have led.
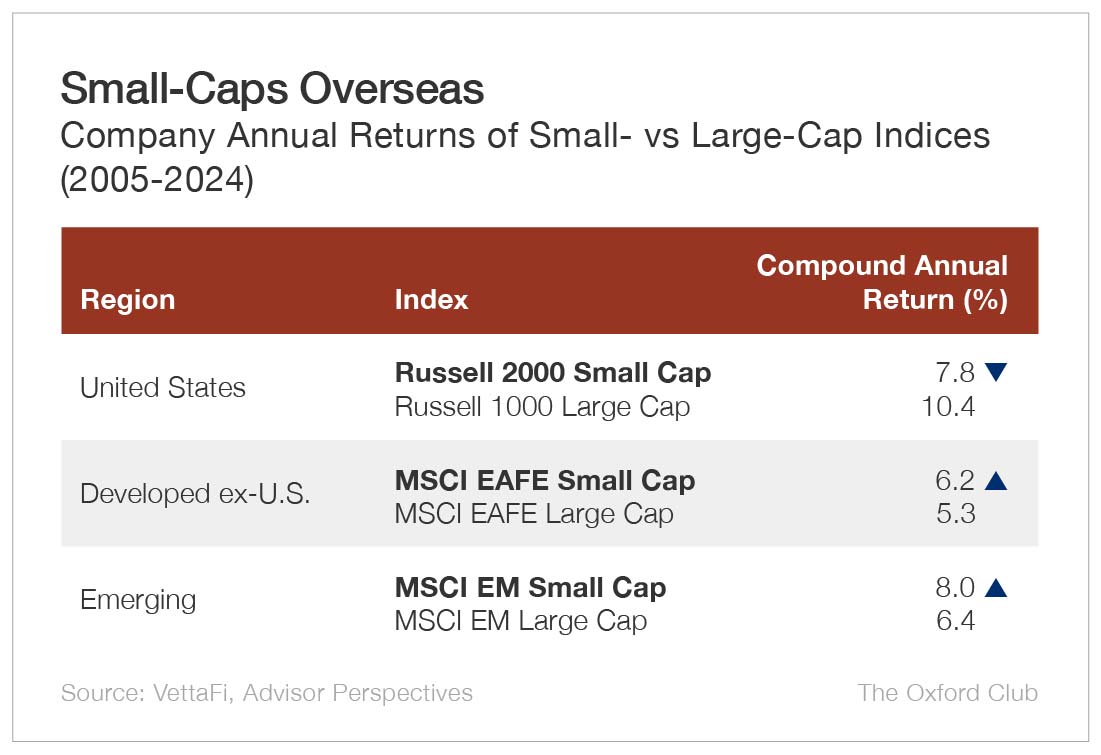
Leadership rotates. Valuation gaps close. That is how cycles work.
The long-run data also suggests the U.S. gap is likely to narrow. Trends mean-revert, and current valuations help. (When you can buy durable small businesses at a discount while attention fixates on mega-cap winners, the odds tilt in your favor.)
That’s why it’s better to buy when small caps are out of favor – when focus is elsewhere and sentiment is sour. It’s not about calling a top or a bottom. It’s about treating price as a key part of the process and letting time do the heavy lifting.
Today, that discipline seems boring. Good. Boring sets you apart.


