
The market is repricing the U.S. airline sector in real time. The price of jet fuel has spiked, capacity is shifting, and Spirit Airlines just went out of business after a second pass through Chapter 11.
Investors are rethinking what a fair price looks like for an industry that’s still trying to find steady profits. Some carriers are getting punished. Others are getting a pass.
JetBlue Airways (Nasdaq: JBLU) sits somewhere in the middle. The question is whether the stock price matches the cash flow record behind it.
In the first quarter of 2026, JetBlue posted $2.2 billion in revenue, up 4.7% from a year earlier. However, net loss widened from $208 million to $319 million.
Operating cash flow ticked up from $114 million to $120 million, and load factor – the share of seats actually sold – improved from 80.7% to 82.2% on 9.33 million paying passengers. The airline ended the quarter with $2.4 billion in cash and short-term investments.
Total debt stood at $8.4 billion, against $1.8 billion in stockholders’ equity. That puts debt at roughly 82% of total capital. The company did not return capital to shareholders during the quarter.
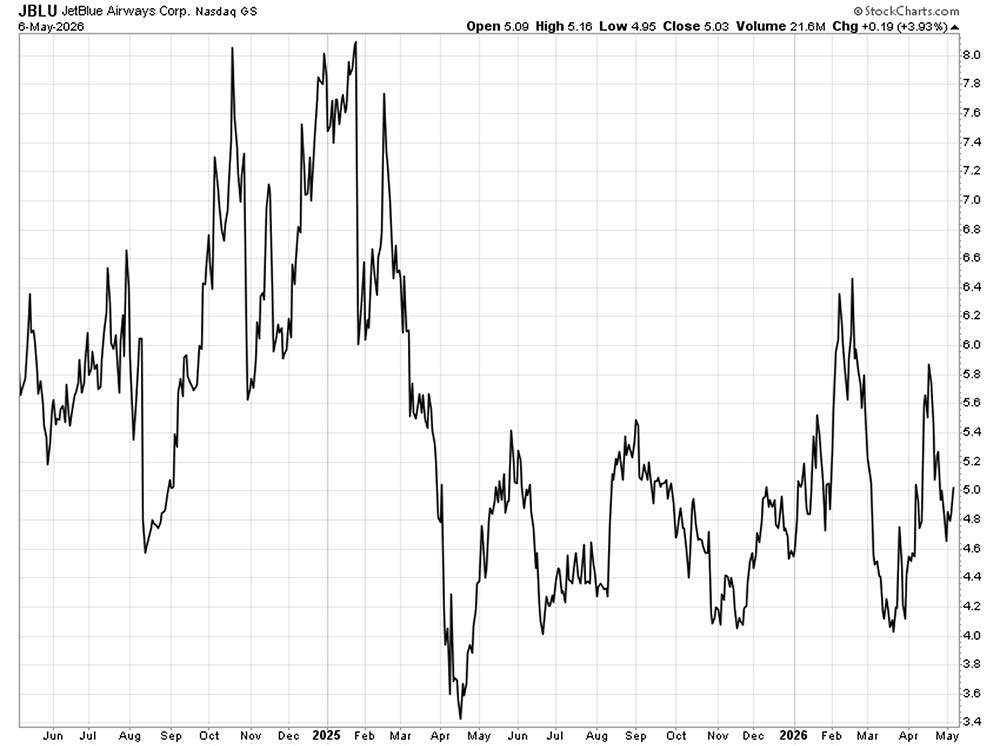
The stock peaked above $8 in early 2025 but then crashed below $4 last spring. It has traded in a wide range since. Over the past few months, it has weakened again, slipping from a February high of $6.40 to around $5 today.
But headline numbers and the stock chart only tell part of the story.
The Value Meter goes deeper.
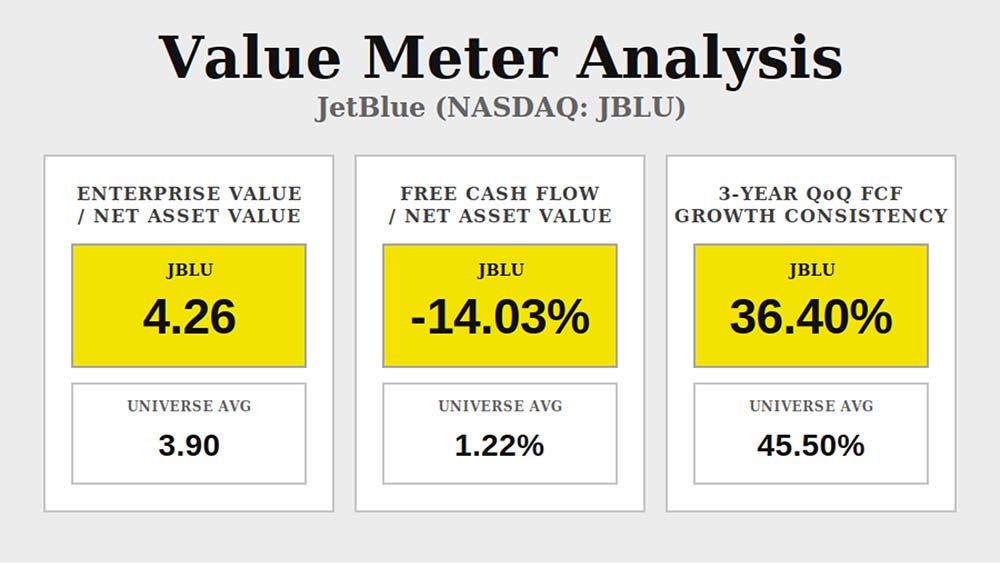
JetBlue’s enterprise value-to-net asset value (EV/NAV) ratio sits at 4.26. The broad market average is 3.9. That’s about a 9% premium. Investors are paying more per dollar of JetBlue’s assets than they pay for the average public company.
JetBlue’s free cash flow-to-net asset value (FCF/NAV) is -14.03% over the past 12 months. The broad market average is 1.22%. One side is making cash from its assets; the other is burning it. A buyer paying a premium is funding the airline’s runway – that is, its future operations – not its current cash returns.
Over the past three years, JetBlue grew its quarterly free cash flow just 36% of the time, versus 46% for the broad market. That pattern reflects a business shaped by fuel cycles, weather, and capacity moves – not steady growth.
For investors buying JetBlue at its current price, the upside rests on a turnaround, not on the rhythm the airline already shows.
The question the data raises is whether the premium is earned.
Right now, it isn’t. JetBlue trades above the market on an asset basis while burning cash, and its quarter-over-quarter cash flow growth runs below the broad average.
The disconnect is simple: The price assumes a recovery that the company’s record has not yet delivered.
The market is pricing JetBlue at a modest premium to broad-market norms. The numbers show a cash-burning carrier with uneven growth and no margin of safety at the current price.
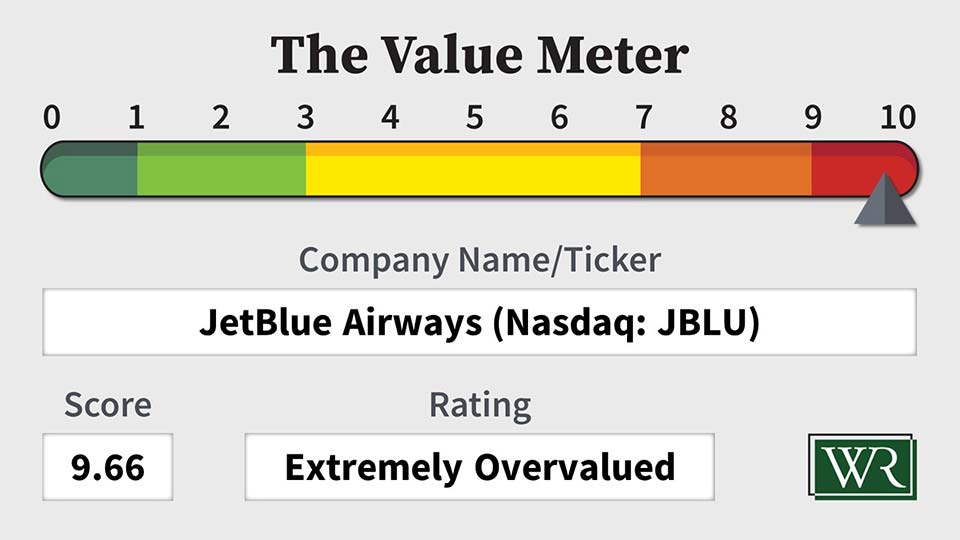
The Value Meter rates JetBlue as “Extremely Overvalued.”
What stock would you like me to run through The Value Meter next? Post the ticker symbol(s) in the comments section below.


