

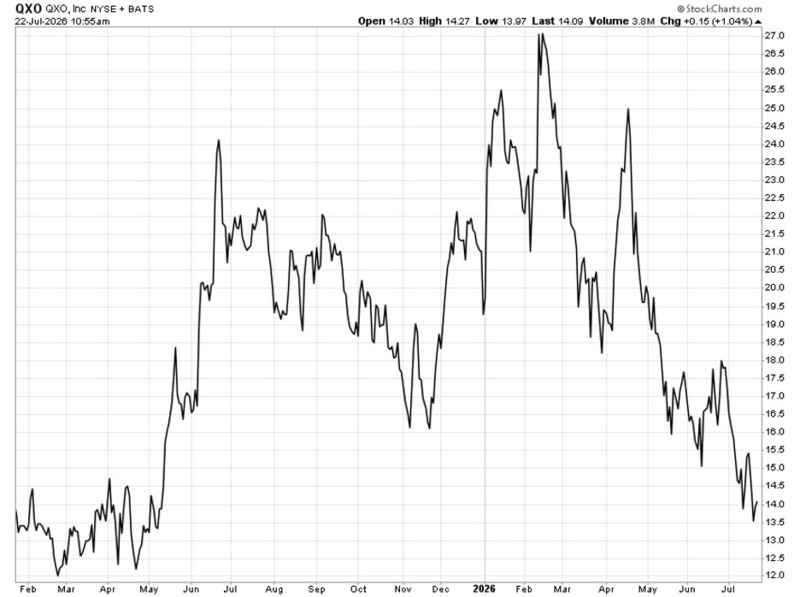
When a company gets much larger while its stock price gets much smaller, something’s not quite right. Clearly, investors are doubting that bigger sales mean bigger profits.
That’s the trouble with QXO (NYSE: QXO).
The company sells and installs building products − including roofing, insulation, waterproofing, lumber, and other materials used in construction and repair − across North America. However, most of its growth has been spurred by buyouts.
In the first quarter of 2026, QXO reported $1.7 billion in sales, up from just $13.5 million a year earlier. But that comparison is misleading because of QXO’s acquisition of Beacon Roofing Supply in April 2025. By the company’s own admission, most of the increase came from adding Beacon’s roofing and building-products business.
A more useful comparison is with Beacon’s own results from a year earlier. Beacon reported $1.9 billion in sales in the first quarter of 2025. In the first quarter of 2026, that same building-products business generated about $1.7 billion under QXO, a decline of roughly 10%.
The takeaway is that QXO’s reported sales soared because it added Beacon, but the business itself sold less than it had a year earlier.
QXO also posted a net loss of $227.1 million in Q1 2026, and adjusted EBITDA (earnings before interest, taxes, depreciation, and amortization) was just $1.2 million. The business barely broke even on that measure.
Furthermore, QXO has continued its spending spree since integrating Beacon. It acquired Kodiak Building Partners for $2.25 billion on April 1 of this year, and it bought TopBuild for $17 billion at the beginning of July.
Management believes these acquisitions will lead to long-term growth, but the market doesn’t seem so sure. The stock has been falling for months.
With soft demand and thin profits, investors seem less willing to pay for the plan before they see the results.
Now let’s run QXO through The Value Meter.
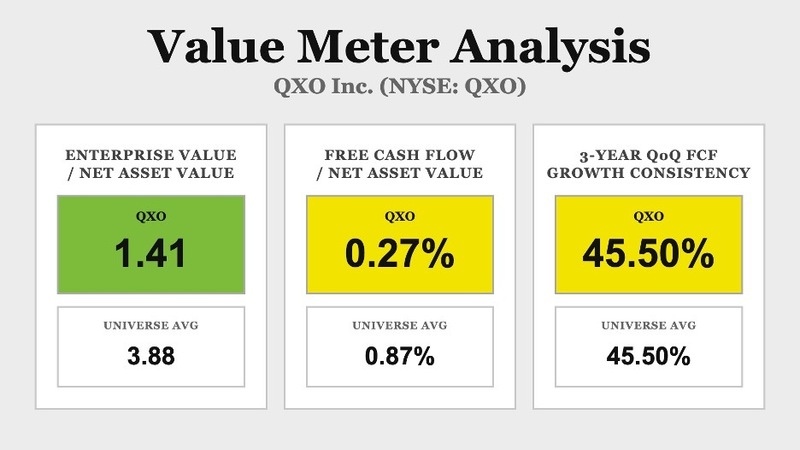
The first question is what investors are paying for QXO’s assets.
Its enterprise value-to-net asset value ratio is 1.41. The broad market average is 3.88. That makes QXO’s EV/NAV about 64% lower than the market’s, meaning investors are paying far less for each dollar of QXO’s assets.
QXO’s trailing 12-month free cash flow-to-net asset value ratio is 0.27%. The market average is 0.87%, so QXO’s FCF/NAV is about 69% lower than the market’s.
That’s the catch. The assets may be cheap, but they have not produced much free cash.
Over the past three years, QXO’s quarterly free cash flow rose from the prior quarter 45.5% of the time. The market average is also 45.5%.
QXO may become more attractive if its margins and cash flow improve. For now, its weak cash record offsets the low asset valuation.
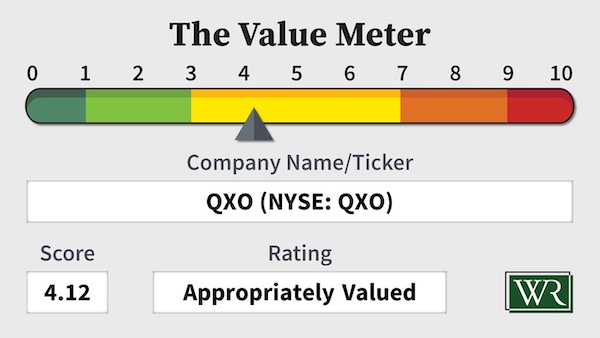
The Value Meter rates QXO as “Appropriately Valued.”
What stock would you like me to run through The Value Meter next? Post the ticker symbol(s) in the comments section below.