
EchoStar (Nasdaq: SATS) has a story investors can understand. It owns a mix of wireless, pay TV, broadband, and satellite assets, and the market is looking for hidden value in that mix.
The cash story is harder. A higher stock price can show better sentiment, but it does not erase weak free cash flow or a heavy debt load.
Through brands like DISH TV, Sling TV, Boost Mobile, Hughes, and HughesNet, EchoStar reaches homes, businesses, carriers, and government users. That reach gives the company scale, but it also comes with high costs (which shrinks part of its subscriber base) and a balance sheet that leaves little room for error.
In the first quarter of 2026, EchoStar reported revenue of $3.7 billion, down from $3.9 billion last year. The company’s net loss was $146.9 million, better than a loss of $202.7 million in the first quarter of 2025. Operating cash flow was $238.3 million, up from $206.8 million.
Demand was mixed. Pay TV subscribers fell by about 366,000, retail wireless subscribers rose by about 16,000, and broadband subscribers fell by about 58,000.
Liquidity was about $1.5 billion at the end of the quarter. Total debt and other obligations were about $24.3 billion. Based on EchoStar’s reported debt and equity, debt made up about 81% of its capital structure, which is concerning.
The share price suggests investors have grown more willing to give EchoStar the benefit of the doubt. Over the past several months, sentiment looks neither euphoric nor broken, but it does look more patient than the financial results alone would suggest.
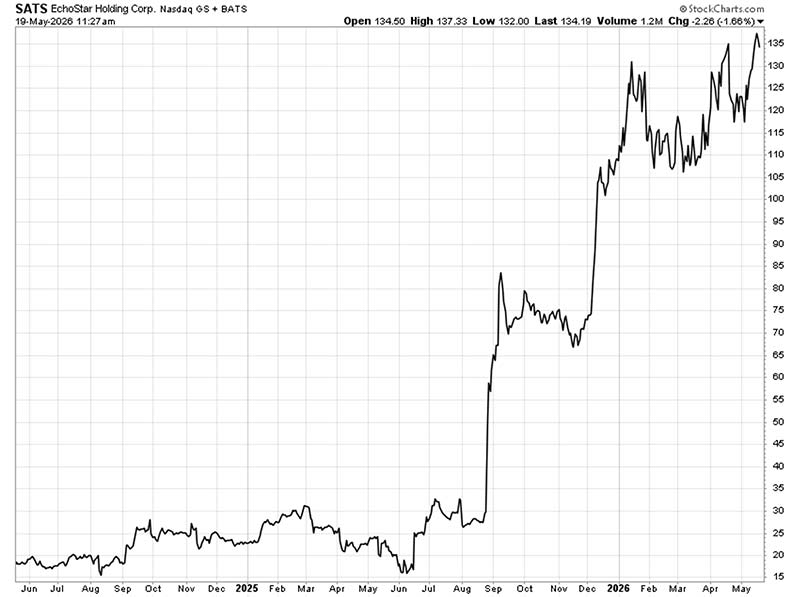
That creates a tension: The stock is acting better than the cash flow story.
That gap matters. The market is giving EchoStar credit for a cleaner future, while the latest numbers still show pressure in the core business.
The Value Meter checks that story against the price.
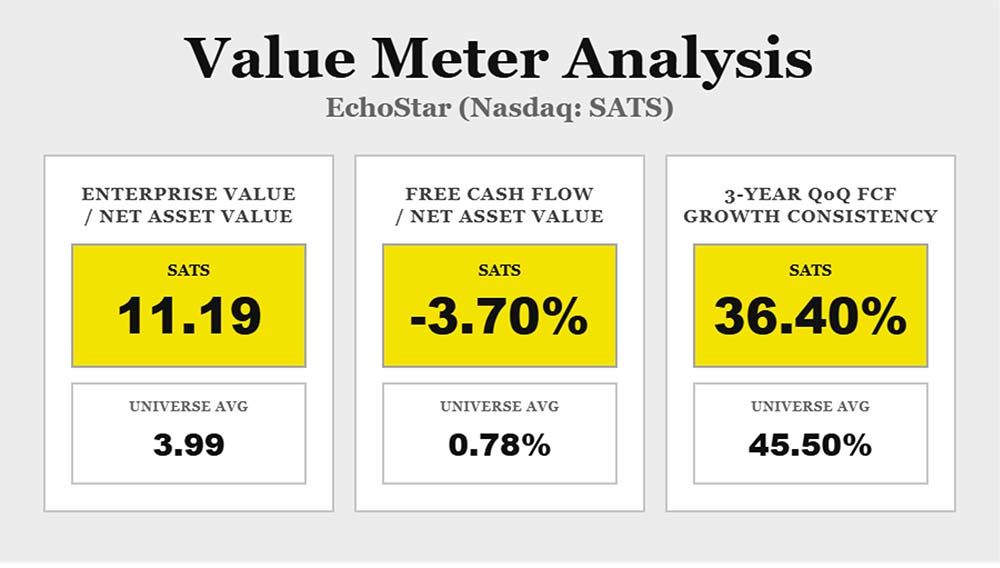
EchoStar’s enterprise value-to-net asset value (EV/NAV) ratio is 11.19, versus the broad market average of 3.99. That is about 180% higher than the market average, which means investors are paying a much richer price for each dollar of assets.
The company’s free cash flow-to-net asset value (FCF/NAV) over the past 12 months is -3.70%, versus the broad market average of 0.78%. Clearly, the company is not turning its assets into free cash flow at a normal rate. For investors, that makes the high valuation harder to defend.
Over the past three years, EchoStar grew its free cash flow over the prior quarter 36.40% of the time. The broad market average is 45.50%. That weaker rate shows that the company’s cash flow progress has not been steady, which adds risk when the stock already carries a steep price.
The market appears to be betting that EchoStar’s assets will become more valuable and cash flow will improve.
The data does not support that view yet. EV/NAV is high, FCF/NAV is negative, and free cash flow growth has been less steady than the market average.
This is not a bad company, but it is a difficult valuation.
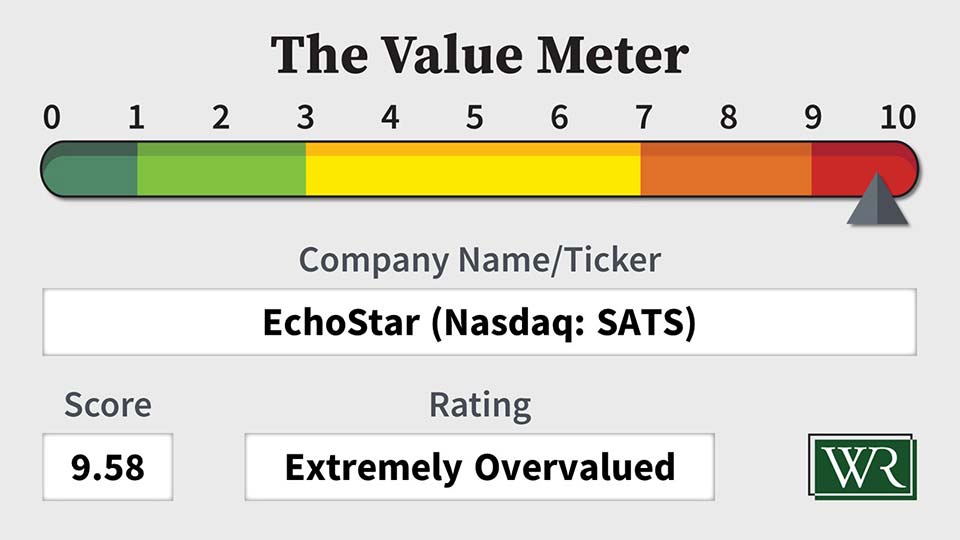
EchoStar looks stretched and is not attractive at this price.
The Value Meter rates EchoStar as “Extremely Overvalued.”
What stock would you like me to run through The Value Meter next? Post the ticker symbol(s) in the comments section below.


